HOME | QUICK START | IN DEPTH | ABOUT ME | ABOUT APP

In Depth Tutorial on Using GridTracks
Viewing Summary Data
The primary two summary data statements are the Balance Sheet and the Income Statement. Balance Sheets give you an overview of all your assets, liabilities, and changes in Owner's Equity (CR). The Income Statement shows all your revenues and expenses, and determines the net income. Note that the net income determined from the Income Statement is used in the Balance Sheet as well.
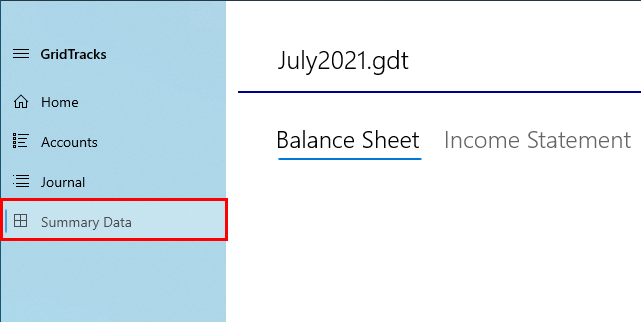
Note that if you look on the lefthand navigation pane, you will see the option for Summary Data. Here you can see the automatically generated Balance Sheet and Income Statement. If you wish to switch between the two, just hit the toggle text on the top.
Note that you can modify the headers for the balance sheet and income statement via the Settings page. The headers both look like:
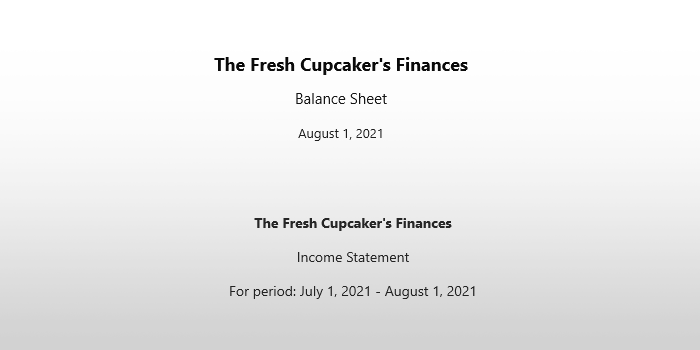
To change the header name and dates on both the balance sheet and income statement, go to the Settings page, located at the bottom left of the page, in the navigation view. At the top of the Settings page, you will see:
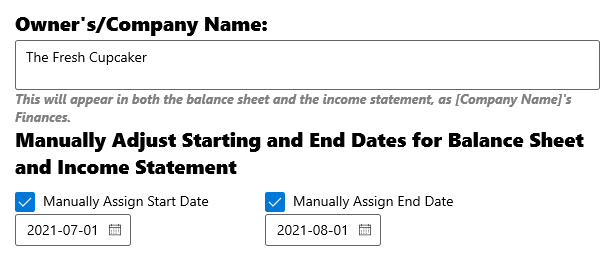
The textbox at the top is where you input your company name. Whatever name you choose here, will show up in the headers of both the balance sheet and income statement, as [compnay name input]'s Finances.
The two date pickers below the textbox will allow you to adjust the starting and ending dates on your financial statements. For both statements both the Manually Assigned Start Date and End Date are used. Please note that for the start date, you must pick one that occurs on or before the very first General Journal entry, while the end date must be set on or after the date of the last entry in the General Journal. If you create a new journal entry before the manually assigned start date or manually assigned end date, then the manually assigned date will be inactivated.
Please note that if no start date is provided, the date of the first General Journal entry will be used. Likewise, the date of the last General Journal entry will be used if no end date is provided. If there are no General Journal entries, then today's date will be used for everything.
The Balance Sheet
The purpose of the balanbce sheet is to give you a snapshot of your finances at any given time. GridTracks makes it very easy for you to view your balance sheet at any time.
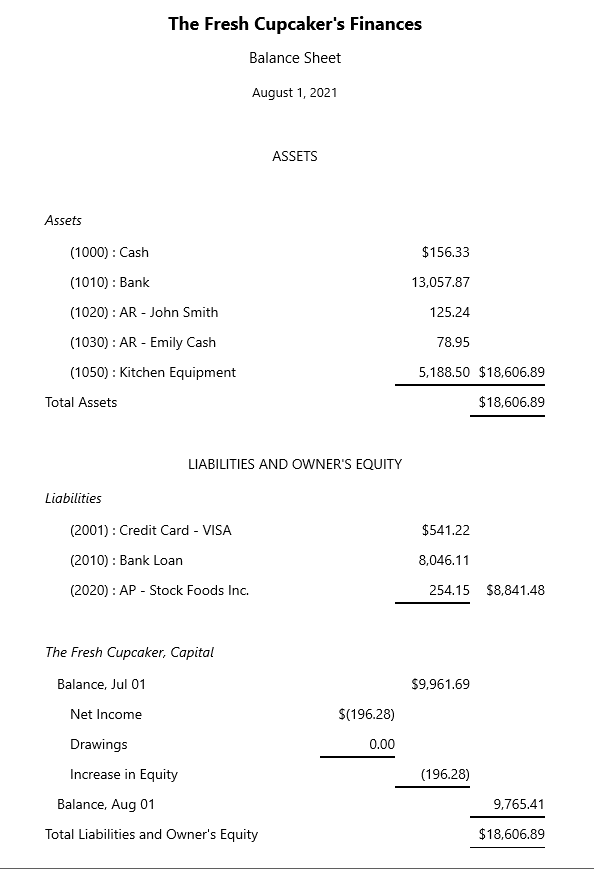
Above is the automatically generated Balance Sheet by GridTracks. Note that at the top, you have access to all your assets, and their current values. From there, you can also see the total value of all your assets.
In the second part of the balance sheet, you have the current values of all your liabilities listed, as well as their total credit value.
Finally, in the Equity section, you have your equity at the beginning, before General Journal entries have been applied. Drawings (O. Equity (DR)) is taken out of net income to give you Increase in Equity, which is applied to the beginning balance, giving you the end date balance. Note that net income comes from the income statement, which you will see in the next section.
It is important to see that the balance sheet is balanced, meaning that total assets is equal to total liabilities and owner's equity. If they are no balanced, then there is something wrong with your account starting values and that must be addressed.
Liquidity
When you go to a bank or financial institution for a loan, they will use your balance sheet to determine your liquidity. There are two types of ratios used: the current ratio, and the acid ratio tests.
-
Current Ratio Test
This test is defined as (current assets) ÷ (current liabilities). Note that all current assets and current liabilites are those that are only around for 12 months or less. Go to Creating Accounts for more details.
Lenders will be looking for a current ratio between 1.20 and 2.00, so a ratio of 1.69 would be good. Anything below a 1.00 is bad because it implies that the company does not have enough assets to pay off their liabilities.
-
Acid Test Ratio
This test method is stricter than the Current Ratio Test method. With respect to assets, the Acid Test only looks at your business's cash, short-term investments, and Accounts Receivable. Things like inventory are not counted because it is not easy to quickly convert inventory into cash.
Just like in the Current Ratio Test, we are looking for (quick assets) ÷ (current liabilities). Lenders will consider a quick ratio of around 1.0 to be good. If your acid test ratio is below 1.0, you may have to sell off some short-term investments or take a loan until you are able to sell more services/inventory.
Assessing Debt
You may want to use the debt-to-equity ratio to see if you have the capital to take on more loans. Just take total liabilities from your balance sheet, and divide it by total equity (balance at end of period): (total liabilites) ÷ (total equity). Generally you want a ratio of about 1.0, to show that you have enough equity to pay off your debts. If it is higher, you may have to either lower your debt levels or invest more money into the business before banks may feel comfortable lending to you.
The Income Statement
You can also see your income statement very easily in GridTracks. If you click on the tab for Income Statement to the right of the Balance Sheet tab, you will be presented with:
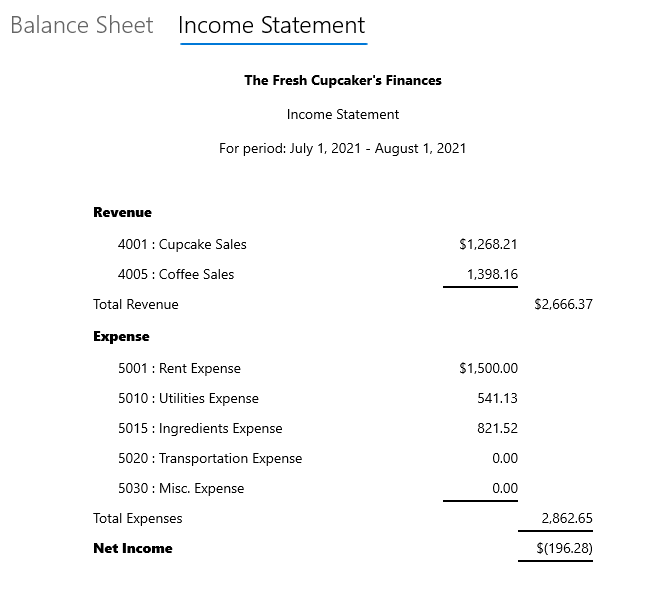
Note that the income statement just consists of total revenue, expenses, and net income/loss.
It gives a breakdown of where your money is going.
Testing Profits
Every once in a while you should test your profits to see how well you are doing, and to compare it with other years as well. These are Return on Sales (ROS), Return on Assets (ROA), and Return on Equity (ROE). Please note that because incorporated businesses must pay income taxes while unincorporated businesses do not, you cannot use these techniques to compare the two.
-
Return on Sales (ROS)
This ratio is sometimes called the Profit Margin. You use this to determine the profit you received from your sales.
This is calculated by: (net profit before income taxes) ÷ (net sales)
-
Return on Assets (ROA)
This ratio is used to determine how well the business utilizes its assets to make sales.
This is calculated by: (net profit before income taxes) ÷ (total assets)
-
Return on Equity (ROE)
This ratio is used to determine how sucessfully your business generates profit for your shareholders/owners.
This is calculated by: (net profit before income taxes) ÷ (total Owner's Equity (CR))
Next Step
Credits
Please note that most of the information from this site is taken from the book "Bookkeeping for Canadians for dummies" by Lita Epstein and Cécile Laurin.
(Epstein, L., & Laurin, C. (2019). Bookkeeping For Canadians For Dummies. Hoboken, New Jersey: John Wiley & Sons, Inc.)